POS Site Selection
Capture the full potential value of POS density
Is MyNextPOS right for you?
- You recruit your POS based on business rules, e.g. 100 subs for 1 POS in an urban area.
- You spend a lot of time focusing on Active and Dormant POS without seeing results on your revenue
- You don’t know which POS are profitable or not to avoid churn

Optimize profit and growth by knowing exactly where to set up your next POS

Act on your POS density
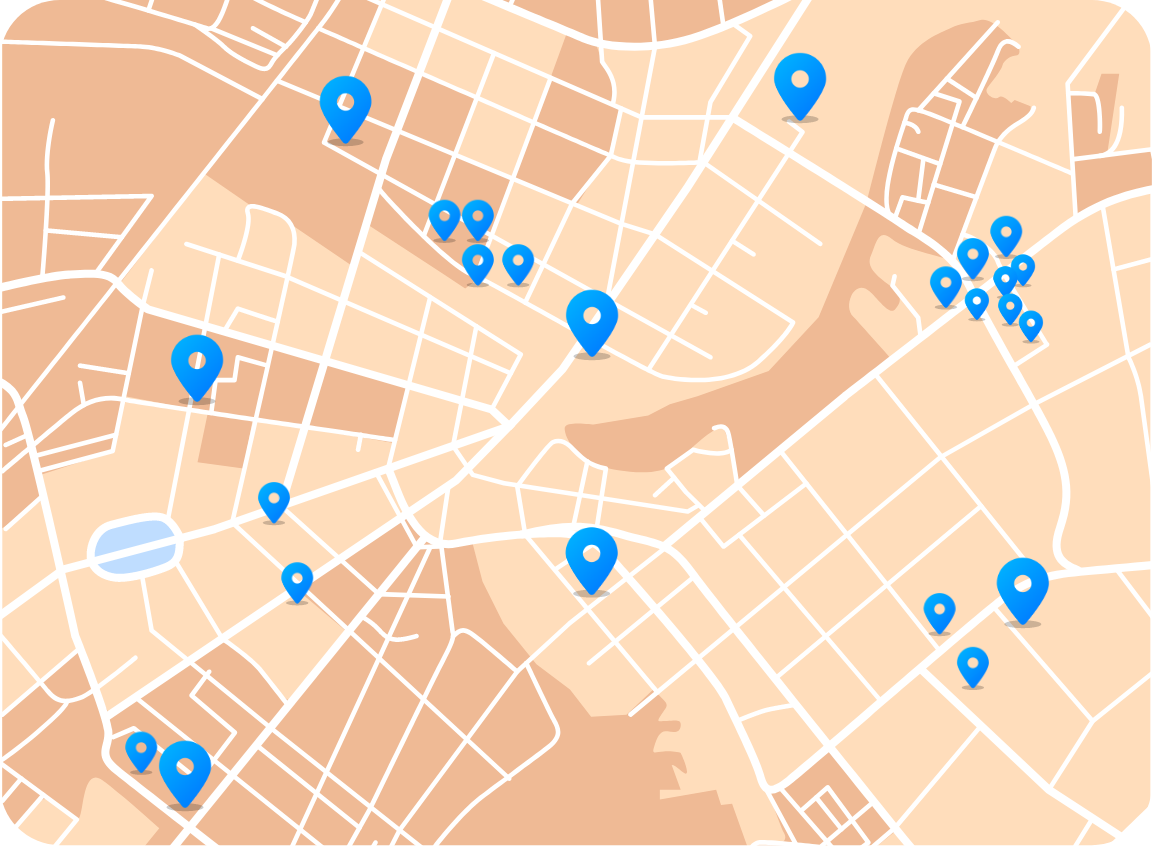
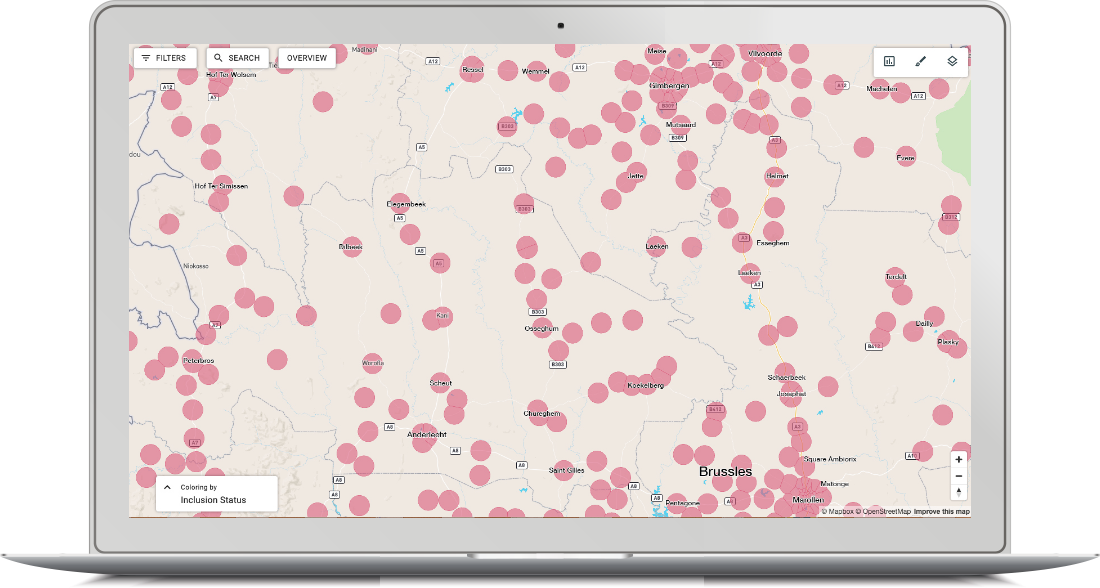
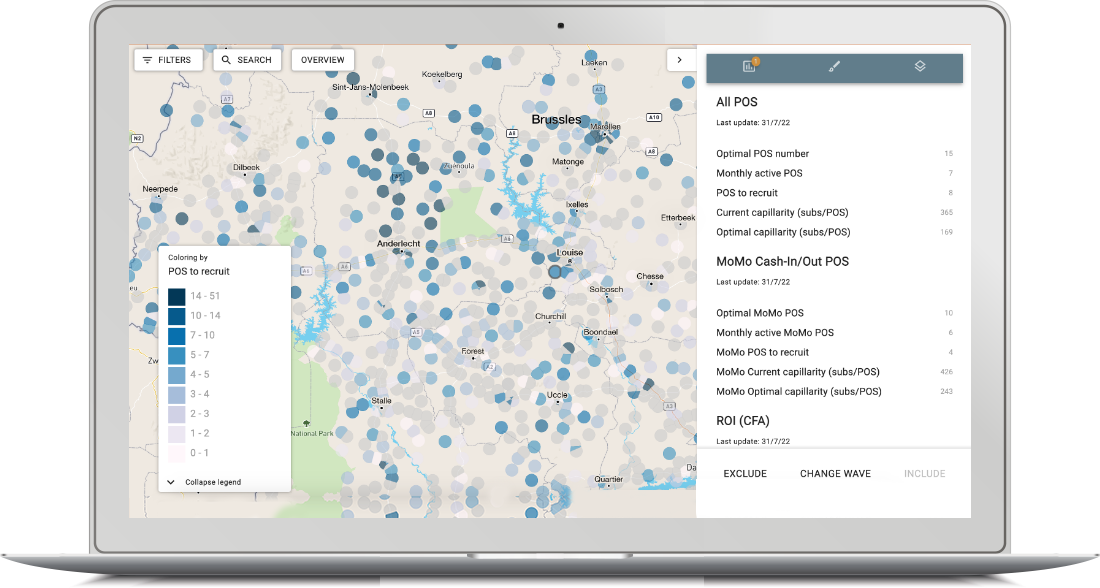
With its intuitive and user-friendly visualization, MyNextPOS shows you where to recruit your next POS. It helps you understand the right amount of POS needed in each site or area and only focus on the sites where the optimal density is not yet reached.
Grasp your POS performance in details
Visualize your POS performance based on your internal database as well as external data sources. MyNextPOS provides additional information about your areas (population, wealth, Points of Interest) and smart KPIs such as POS penetration over the population or POS profitability.


Get POS recommendations
MyNextPOS prioritizes the next best POS by forecasting their value
Profiling
Your data (recharges, SIM, MoMo transactions, CDRs…) is combined with open-source data to give every existing POS and site a profile (e.g. site data usage, wealth, index…)
Look-alike modeling
By using different algorithms, existing sites are clustered together in group (e.g. DBScan, K-means Clustering, …) to detect similar profiles.
Candidate scoring
MyNextPOS then forecasts the value of every site and POS. The forecasted value is used to score and prioritize the next best POS
Tackle financial opportunities with MyNextPOS

profitable POS

inactive POS in crowded areas

the right POS at the right place
Discover how MyNextPOS optimise your POS
site-selection
- Include external data sources (population, relative wealth index, etc.)
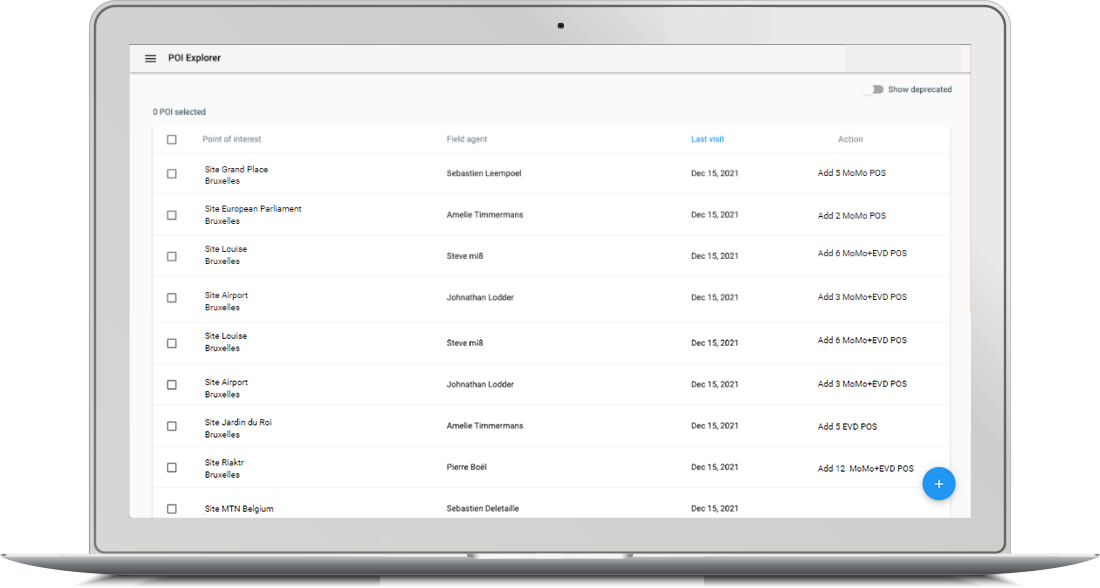
- Add new POS at strategic places to upscale capacity and/or cover new subscribers
- Receive flags for crowded areas where there is no need to focus on inactivity POS
