Impact of averaging
February 2019
By the Smart Capex Team
The “flaw of averages” states that plans based on assumptions about average conditions usually go awry. Despite this warning, the use of averages in business is still prevalent and, in many cases, misleading. Telecom operators (telcos) are no exception to this observation, especially when planning for large Capex projects.
In this case, averaging is not due to data unavailability, because telcos do benefit from a wide set of proprietary data. The problem is that the data is split between multiple departments. As a consequence, not all the departments that are involved in the Capex case have access to the same data. The lack of a singular, shared view between all actors forces each team to make assumptions on the data they miss. In addition, human beings are not particularly good at dealing with extremely large datasets. This context leaves the door open to blind assumptions. Aggregated data will typically be used to assess the areas of the country in which new technologies should be deployed (referred to as “investment candidates”). The national ROI of an investment scenario will then be used at lower geographical levels. We witnessed that the set of criteria used at this stage, for instance, to assess the profitability of neighborhoods, is far from being data-driven.
The usage of averages distorts business results. As a matter of fact, business executives from a leading telco confessed that the profitability of potential investment candidates was assessed using personal gut feeling and subjective factors. But what would happen if the power of data analytics was harnessed to use singular numbers to inform network investment planning?
This case studies the impact of de-averaging cash flows used to assess FTTH investment.
Context
In order to assess the impact of averaging on FTTH investments, we used data from a European telco leader. The investment scenario is a fiber investment case. Under an approach using conservative tools and methodologies, cash flows based on averages were used as a proxy to compute the profitability of investment candidates.
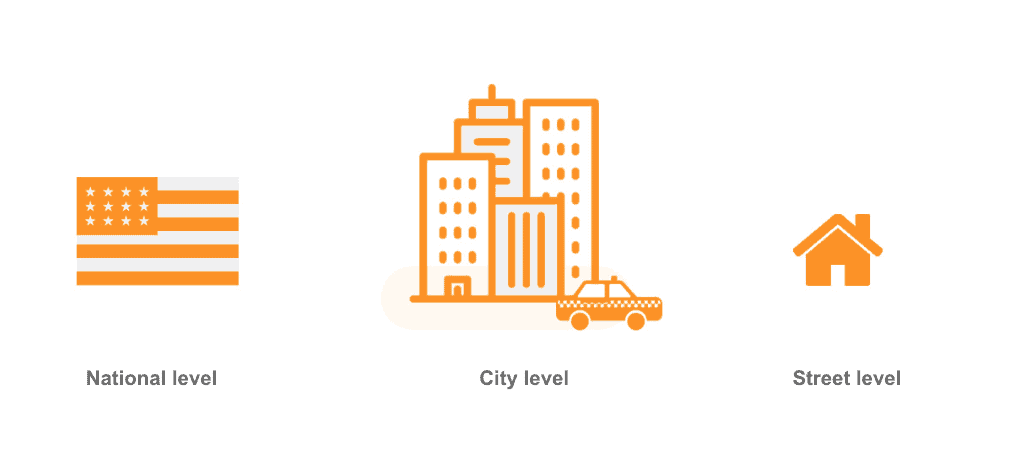
This case compares the results based on this national average ROI of investment candidates with actual ROI figures taken at a city and at a street level. In other words, we assess the value of adding granularity to the data inputted in an NPV formula. In this case, the most granular information was built at the NIS 9 level. NIS 9, or “statistical sectors” are the smallest division of the country used by the Belgian National Institute of Statistics. Using NIS 9 sectors, we computed averages at a country and city level.
Including this level of granularity in NPV computations would have been impossible with the sole use of Excel but the emergence of new tools and technologies allowed us to overcome such limitations.
Hypothesis
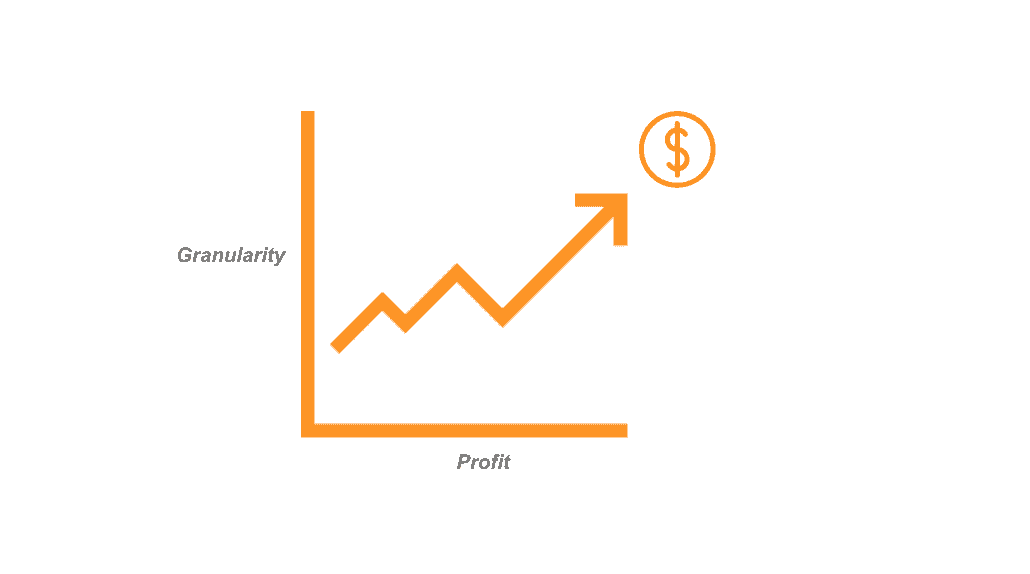
Our hypothesis states that the projected returns of an investment plan increase with the level of granularity of the data used.
Therefore, we expect a gain in NPV when making computations more accurate. In each case, all candidates with a positive NPV were retained to estimate the total projected return.
Results
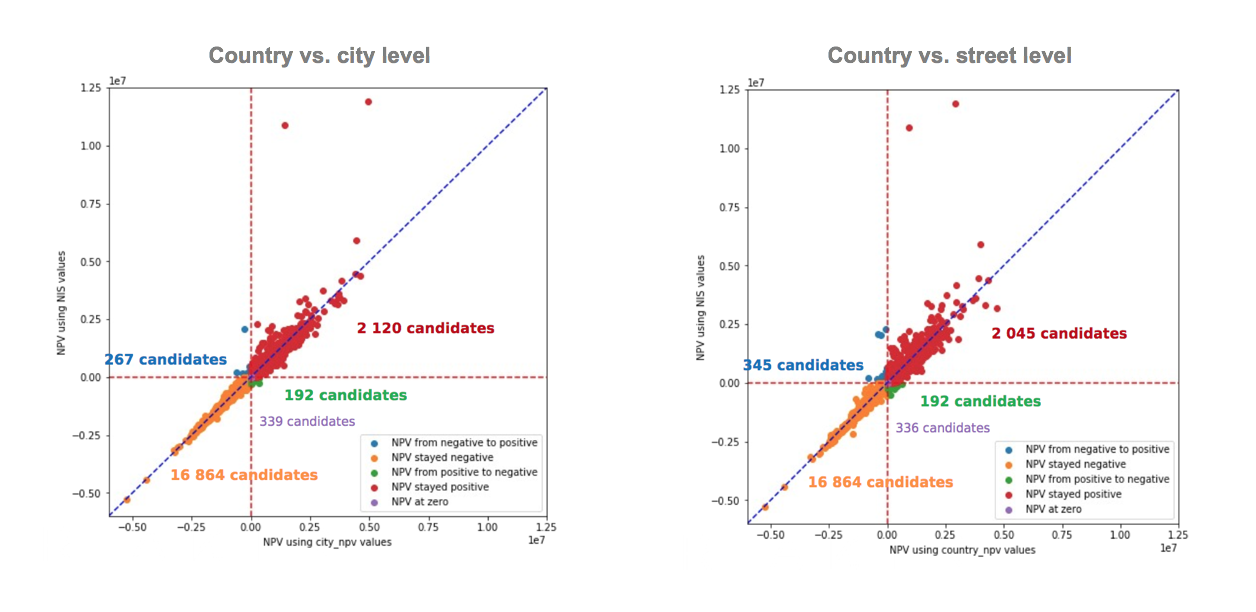
Under a national split, the total projected return was calculated to be close to 1 billion EUR.
When injecting projected revenues at a city level in the NPV formula, the present value of revenues increased by 1.5%, which is close to 15 million in value.
Going one level lower into the data granularity by taking projected revenues at a street level generated a 4% uplift compared to the initial scenario using a national average. That is close to 40 million in value of additional revenue.

In addition, when looking at the number of candidates that became positive when adding levels of granularity: out of the total 19,782 candidates, 347 candidates became positive when using street data compared to 267 candidates when using city data.
Put simply, reversing a top-down approach to a bottom-up process that considers the exact ROI of each geographical subdivision at its more granular level shows significant revenue gains. This confirms the impact of using granular data to maximize investment plans. The higher the granularity of the data inputted in the NPV, the higher the resulting returns.
Conclusion
This case shows that averaging generates losses that amount to millions. Adopting a more granular level of information helps companies truly optimize their Capex allocation, taking the best candidates into account and generating a higher NPV. Whereas a lot of attention is already given to optimizing the financial formula, the ability to use big data analytics opens up new avenues to optimize the content of this formula. Allowing wider data sets to be taken into account will be key to investing in network assets with full confidence. Considering that this method shows only the impact of de-averaging, excluding some other factors such as border effect or multiple approximations, one can imagine the size of the profits a full-fledged data-driven CAPEX investment plan can unlock.
Want to read more use cases from our Smart Capex team? You might be interested in “The impact of copper switch-off”
Smart Capex Labs
Smart Capex Labs is a series of use cases that illustrate the factors that can hinder a company from realizing the full potential of their data dollar.
Each case addresses a single common costly data management issue and shows how our Smart Capex software solves it, ultimately bridging the 17% gap between current results and the optimal investment scenario.