By implementing lean benefit management, a telecom operator was able to re-evaluate the technology and geography choices for the investments and re-forecast its revenue, allowing it to improve its financial management practices in full confidence.
Performing post-mortem analysis allows telecom operators to adapt subsequent investment waves and close the gap between strategic planning and execution.
This case demonstrates how an operator gained an 8% ROI on its network rollout plan by adapting its second deployment wave based on insights and knowledge gained from the previous wave.
Adopting Lean Benefit Management: Introduction

By the end of Q3, CFOs already have a good forecast for their annual results and start preparing a new budget for the upcoming year. Some budgets are sales driven, others are production-driven and telecom budgets are often driven by capital expenditure plans.
A network investment plan is typically structured in several waves and rolled out over many years. But defining and running a budget at scale is a complex exercise: historical data may be incomplete, updated external data is hard to get and a clear methodology to select investment projects while assessing expected returns may simply not be available.
Moreover, CFOs must be able to shift resources from one project to another based on real-time information in order to maximize their profits.
Too often, the observed returns on investments fail to meet the expectations of the board, namely because of a lack of flexibility in budget management.
Lean Benefit Management is the art of monitoring the performance of these network investments over time. Adopting a lean approach to network planning can make a real difference in maximizing returns. This lean approach requires assessing the performance of past investments and adapting the strategy accordingly in order to better reflect the potential of future investments. Merely identifying the best areas for future investments (e.g., the most densely populated area, the wealthiest area, etc.) is not enough; the accuracy of these decisions must be analyzed over time to determine the actual return on these investments.
Past Investments Matter in Network Investment Plans
Telecom operators often develop network investment plans that can extend for more than a decade. Identifying the most profitable sites based on future-oriented assumptions is a big challenge that often results in investment plans that are mostly built on hypotheses instead of historical data. This was the case at one of our customers. This particular operator assumed that revenues would come from 4G in densely populated regions but discovered a different reality when digging into the impact of the first investment wave. The following sections explain how we worked together to optimize profits from one wave to the next, looking at data consumption per site, data consumption per region, and gap-to-target per region.
CASE: Increasing Profitability with Lean Benefit Management
One of our customers had a presence in emerging markets and was investing in three different mobile technologies: U2100 (3G), U900 (3G), and L800 (4G). The initial assumption behind the investment plan was that 4G was going to perform better than the other technologies in densely populated areas. Therefore, they invested in building a network that could serve growing data usage.
Six months after the first deployment wave, we conducted a post-mortem analysis of this initial wave. Because most of the operator’s customers were on a prepaid plan, we considered GB consumption as a reliable revenue indicator, and thus a good proxy for the overall performance of the network investment plan. The incremental GB consumption per site was our first measurement.
- GB consumption per site
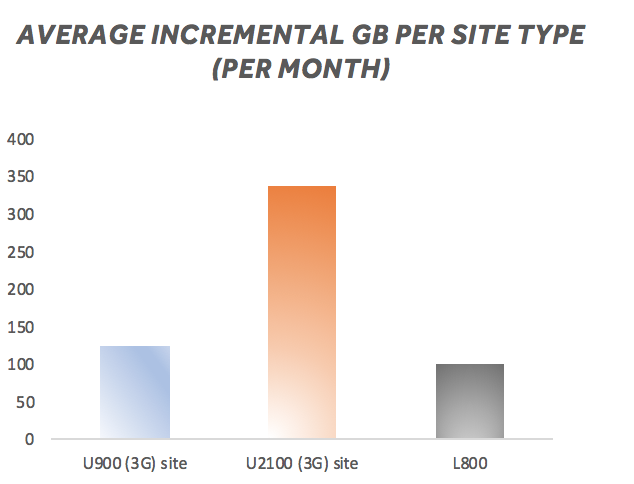
Incremental GB consumption per site type (month) Source: Riaktr data
The incremental traffic per month (in GB) per technology was completely different than expected. Across the country, the U2100 (3G) sites generated over two times more additional data traffic (on average) than the other two technologies.
This turned out to be a key insight that led to the revision and adaptation of future investments plans, which had initially been built around incremental 4G consumption expectations.
To understand this pattern, we examined the data consumption behavior over all types of sites across different regions.
- GB consumption per region
On a regional level, data consumption varied widely from one region to another, regardless of the population density and wealth distribution. In future waves, this information allowed us to add more granularity to the prioritization of candidates in order to serve each region according to their specific consumption patterns.
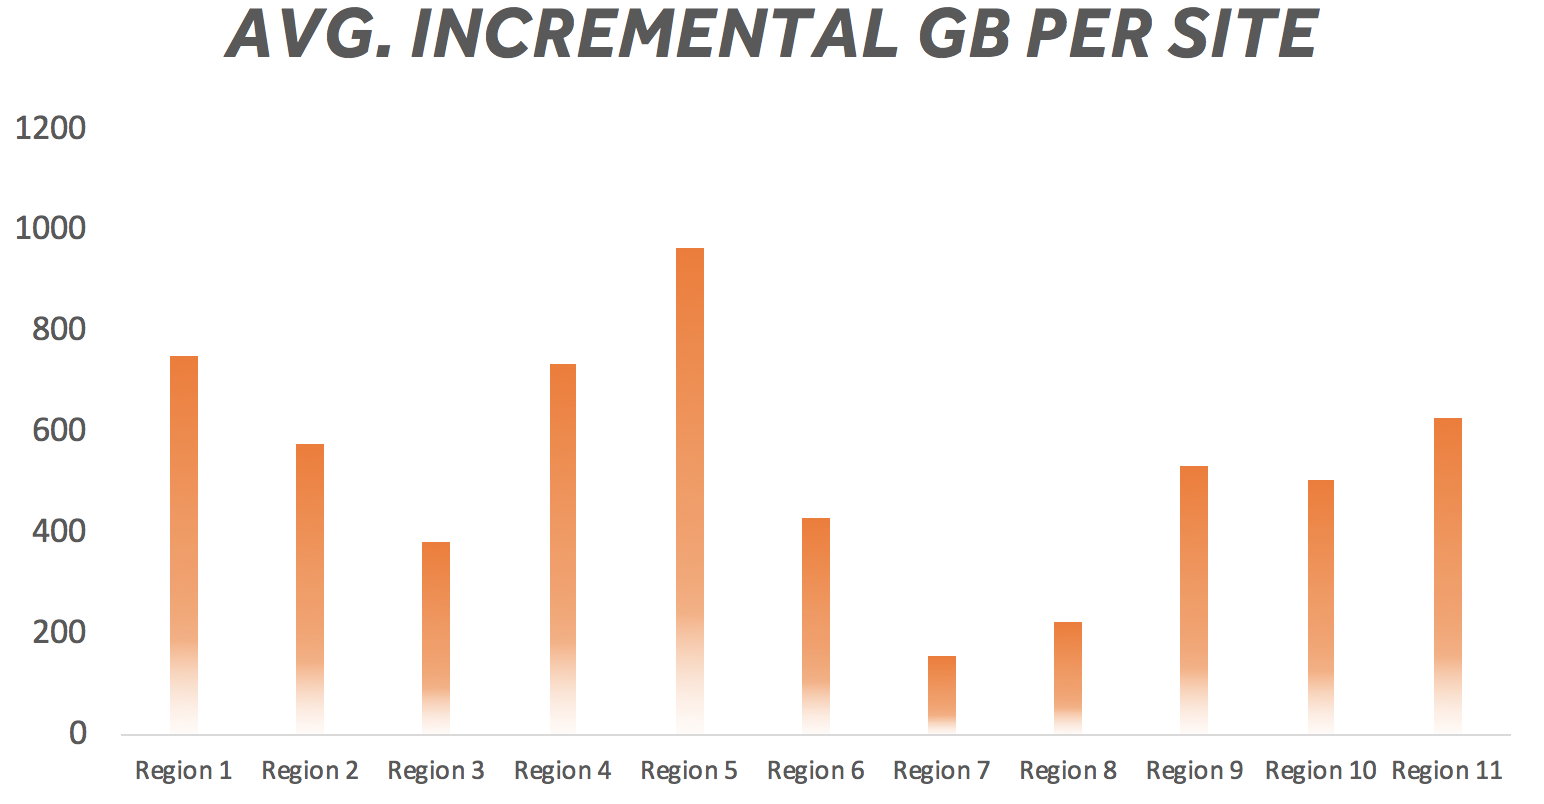
Source: Riaktr data
In addition, we noticed that 4G sites had very low traffic in some regions. This was because they were covering areas where only a small percentage of the population had a 4G compatible smartphone. With this in mind, we decided to add the number of people with a 4G handset as a variable to the prioritization logic.
- Gap-to-target per region
Because accurately forecasting the performance of investments is critical to viable financial management, the gap-to-target is an important metric as it measures whether or not the investments deliver the expected results. In other words, it evaluates the absolute performance from a commercial point of view.
In fact, even deployed investments that are performing well may still be underperforming compared to original projections. This doesn’t necessarily mean that the telecom operator should invest in other candidates (i.e., other areas of the country in which new technologies have yet to be deployed), but it does indicate that the NPV logic needs to be revisited in order to better assess the future value of the different investments and prepare a more accurate ROI case.
In the investment case in question, the investment team had been overly optimistic regarding the plan, which led to big performance deltas in some regions. In particular, the operator had been overly optimistic regarding the data adoption in the city centers. In order to maintain positive returns, it was clear that the targets had to be revised. Without the gap-to-target analysis, the originally planned investments would most likely have led to losses due to poor forecasting.
Conclusion
This case demonstrates that the ROI of a network investment can be significantly increased by analyzing and reassessing investment criteria from one wave to the next. Priority should be given to managing resources over time by identifying, planning, and reviewing expected benefits based on prior experience and in-the-field insight. Analyzing the past performance of previous deployments ensures that the business case keeps generating a positive and measurable impact.
Returning to the example above, the operator in question made changes to the initial plan and was able to gain an additional ROI of 8% on the rollout of the second deployment wave.
The gain was the direct result of three changes:
1) Changing the technology for their second wave of sites
2) Selecting the right geographical zones where they should invest for the second wave of sites
3) Re-forecasting their revenue in order to improve financial management in full confidence
Performing post-mortem analysis and making adaptations to the subsequent investment waves enables telecom operators to close the gap between strategic planning and execution. It ensures a timelier implementation of the most valuable initiatives by basing business decisions on facts and not just on predictions and unvalidated hypotheses.
Enjoyed this read? You might also enjoy “Smart Capex case: The Impact of copper switch-off on Capex investments”
About the authors